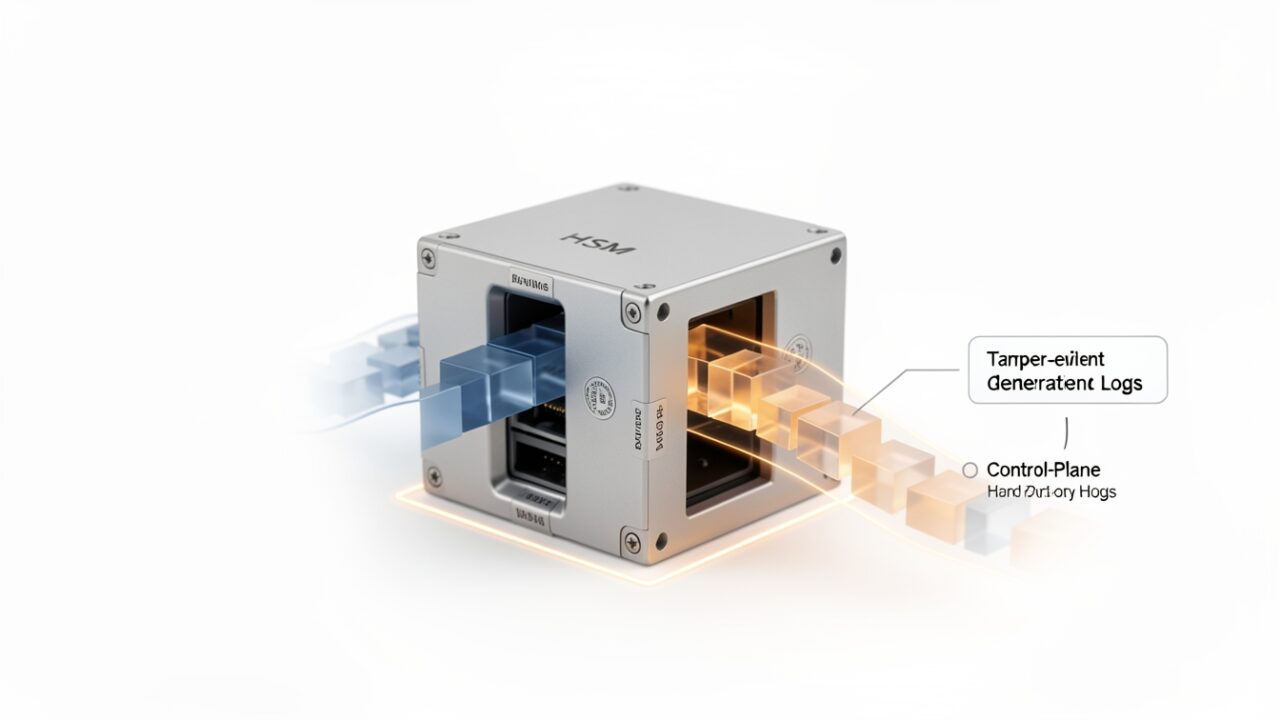
A colleague stopped me mid-coffee this week: “Cloud HSM hardware audit logging went GA. Isn’t that just more of the logs I already get?” Fair hit. We have drowned in telemetry for a decade and every vendor insists the newest stream is the one that finally matters. So let me answer the question the honest way.
No, it’s not the logs you already have — and the difference is entirely about where the record is born.
Your Azure Activity Log and the resource (diagnostic) logs describe what the control plane did: who called the ARM API, which RBAC role let them, which subscription and region the request hit. Useful. Also, from a cryptographic-assurance standpoint, hearsay. The control plane is Azure telling you what it asked the HSM to do. Hardware audit logging is the HSM itself — the physical device inside the FIPS 140 boundary — writing down what it actually did, from inside that boundary. Provenance. That’s the whole feature in one word.
“Fine. Provenance. But logged by whom, of what?”
This is where I’d pump the brakes on anyone selling you “full key visibility.” Read Microsoft’s documented list, not the marketing — and read the current one, because this is exactly the sort of enumeration that grows between preview and GA. What these hardware records cover is HSM management operations: the administrative lifecycle — things like HSM user and role changes, cluster administration, and key lifecycle events such as creation and deletion. Before you commit anything to an auditor, confirm the precise event list against the official docs rather than against your assumptions about what an HSM “should” log.
What this is almost certainly not is a per-operation firehose of every encrypt/decrypt/sign your apps perform. Don’t architect your SIEM budget as if it were. If a framework needs you to prove nobody exported a key, administrative hardware audit records are the right kind of evidence. A tamper-evident count of every RSA signature your payment service made today is a different conversation and a much larger bill.
“Where does it land, and do I need a new pipeline?”
No new pipeline. It rides the plumbing you already run. You wire a diagnostic setting on the Cloud HSM cluster resource and point it at a Log Analytics workspace, a Storage account for cold retention, or an Event Hub for your SIEM. Same model as every other resource log in Azure.
One caveat on the resource ID below: treat the provider path as an example. Confirm the exact provider and resource type registered in your tenant before you script against it:
I’m not going to hand you a category string to paste blind. Run the categories list call, read what comes back, enable what you mean to. Once it’s flowing, you query it in Log Analytics with KQL like any other table:
“And compliance? Or is this a checkbox nobody asked for?”
People asked. PCI-DSS wants logging of access to cryptographic keys and a trail you can’t quietly edit — a record written by the device, not by the orchestration layer around it, is a materially stronger answer to a QSA than “trust our control plane.” FIPS 140 assurance leans on exactly this kind of in-boundary audit. SOC 2 and ISO 27001 key-management controls get an easier evidence story. But here’s the veteran’s caveat, said once and plainly: the log supports an attestation. It doesn’t grant one. Enabling a diagnostic setting is not a compliance program.
On the boring-but-load-bearing questions: this is a capability of the Azure Cloud HSM service — the single-tenant cluster offering, which is a distinct product from Managed HSM and the older Dedicated HSM. Confirm which one you’re actually running before you promise an auditor anything, because the logging stories are not interchangeable. As for cost: there’s no exotic new pipe to pay for — you pay the usual freight for whatever you ingest and retain downstream in Log Analytics, Storage, or Event Hub. For the specific licensing terms of the feature itself, check the GA notes and your Azure account team rather than my word. Ninety days of HSM admin events is noise-floor cheap. Seven years of everything in hot tier is a different invoice.
So, to my coffee-break skeptic: keep the Activity Log, keep the resource logs — this replaces neither. It adds the one witness that was always missing, the device speaking for itself. Turn it on, confirm the category by name, and stop guessing what the HSM did.